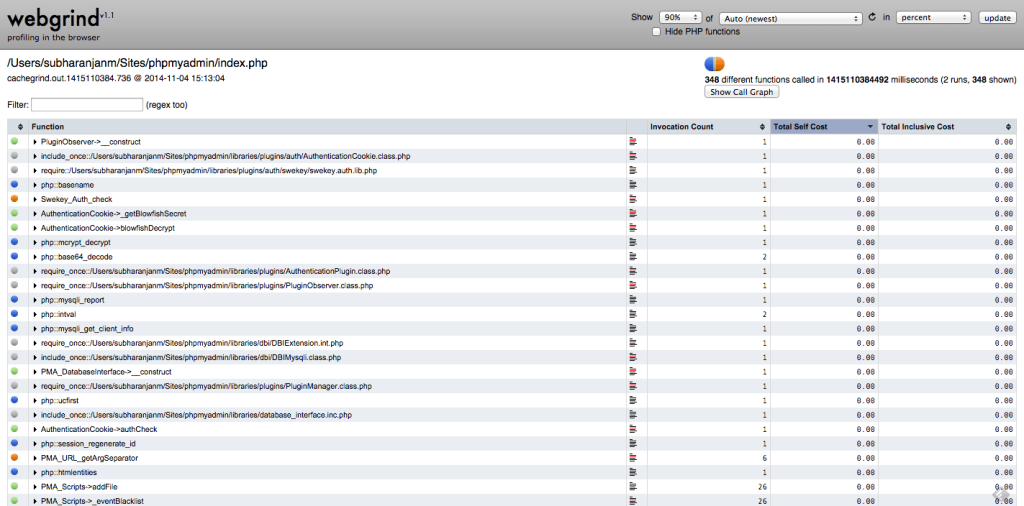
Recently, I have been asked to help install and setup XDebug along with Webgrind in a Mac OS X system using SSH on one of my colleague’s system. All of this setup were done remotely from another system. Here are the steps/commands for achieving the same.
Steps for installing Xdebug:

- Get the information about installed PHP on the system. This is needed to get the custom installation instructions from xdebug website here: http://xdebug.org/wizard.php
clear
php -i
Copy the whole output of the above command and paste it in the textarea provided here: http://xdebug.org/wizard.php
- Get the url for the latest xdebug script and download it to your mac.
sudo cd /tmp/ && curl http://xdebug.org/files/xdebug-2.2.5.tgz > xdebug.tgz
tar -xvzf xdebug.tgz
cd xdebug-2.2.5/
- Compile and build the php extension from the source. Install the same.
phpize
./configure
make
sudo make install
- Enable Xdebug in the php.ini file.
- Find the complete path of the xdebug.so file prior to editing the php.ini file. The path looks something like this: /usr/lib/php/extensions/no-debug-non-zts-20100525/xdebug.so Can be located using the command:
locate xdebug.so
- Edit the php.ini file and add the following lines to the extreme end.
cd /etc/
sudo nano php.ini
Lines to be added:
[xdebug]
zend_extension=/usr/lib/php/extensions/no-debug-non-zts-20100525/xdebug.so
xdebug.file_link_format="txmt://open?url=file://%f&line=%1"
xdebug.remote_enable = On
xdebug.remote_autostart = 1
- Restart Apache.
sudo apachectl restart
- Find the complete path of the xdebug.so file prior to editing the php.ini file. The path looks something like this: /usr/lib/php/extensions/no-debug-non-zts-20100525/xdebug.so Can be located using the command:
Setup Webgrind:
- Download and put Webgrind source into a folder in webserver. ( /Users/subharanjanm/Sites/webgrind/ in my case )
cd /Users/subharanjanm/Sites/
sudo git clone https://github.com/jokkedk/webgrind.git
cd webgrind/
- Create a folder inside /private/var/tmp/ to store and read profiler files by Xdebug and Webgrind. This step can be skipped if you want to use the “tmp” directory directly to write files.
sudo mkdir /private/var/tmp/xdebugprofilers/
sudo chmod 777 /private/var/tmp/xdebugprofilers/
- Make changes needed in the Webgrind config file.
sudo nano config.php
Change the values of these two variables as per the path.
static $storageDir = '/private/var/tmp/xdebugprofilers/';
static $profilerDir = '/tmp/xdebugprofilers/';
- Finally add following lines into php.ini below the xdebug settings to enable profiler and its related paths.
sudo nano /etc/php.ini
xdebug.profiler_enable = 0
xdebug.profiler_enable_trigger=1
xdebug.profiler_output_dir = "/private/var/tmp/xdebugprofilers/"
xdebug.profiler_output_name = cachegrind.out.%t.%p
-
sudo apachectl restart
Now you can append ?XDEBUG_PROFILE=1 into the url of your php script to see the profiling data on Webgrind interface.

Leave a Reply